Cloud Latency Shootout


All the cloud providers advertise the performance of their network as a selling point, but there isn’t much publicly available data that meaningfully measures cross-regional latency. So, we decided to write our own benchmarking harness to compare round trip latencies across several providers.
We were surprised to find that in some cases the spread between the fastest and slowest performing providers was upwards of 30%! In this post we will walk through our benchmarking methodology & results, and dive deep on the theory for interpreting these results.
Benchmarking Methodology
We tested a variety of cloud providers across a variety of regions. For each of our 7 providers, we spun up a VM in the same 6 regions (except for a few cases where a provider wasn't operating in a certain region).
- Providers: AWS EC2, AWS Global Accelerator, Azure, Google Cloud Platform, Fly.io, Digital Ocean, and Contabo
- Regions: US East, US West, Sao Paulo, London, South India, and Singapore
To more closely mimic realistic usage patterns in realtime applications, we set up a WebSocket echo server on each of our VMs and timed how long it took for WebSocket messages to travel back and forth from our headquarters based in New York City. After establishing a WebSocket connection, the benchmark sent 100-byte messages 50 times to each VM. We scheduled the script to run every hour of the day to account for temporal variations in latencies.
We've published our benchmarking script on Github so that you can run it and play with the parameters. Try it out and share your results on Twitter – we'd love to see additional data points from around the world!
Results
This chart provides an overview of the fastest and slowest performing providers across all regions:
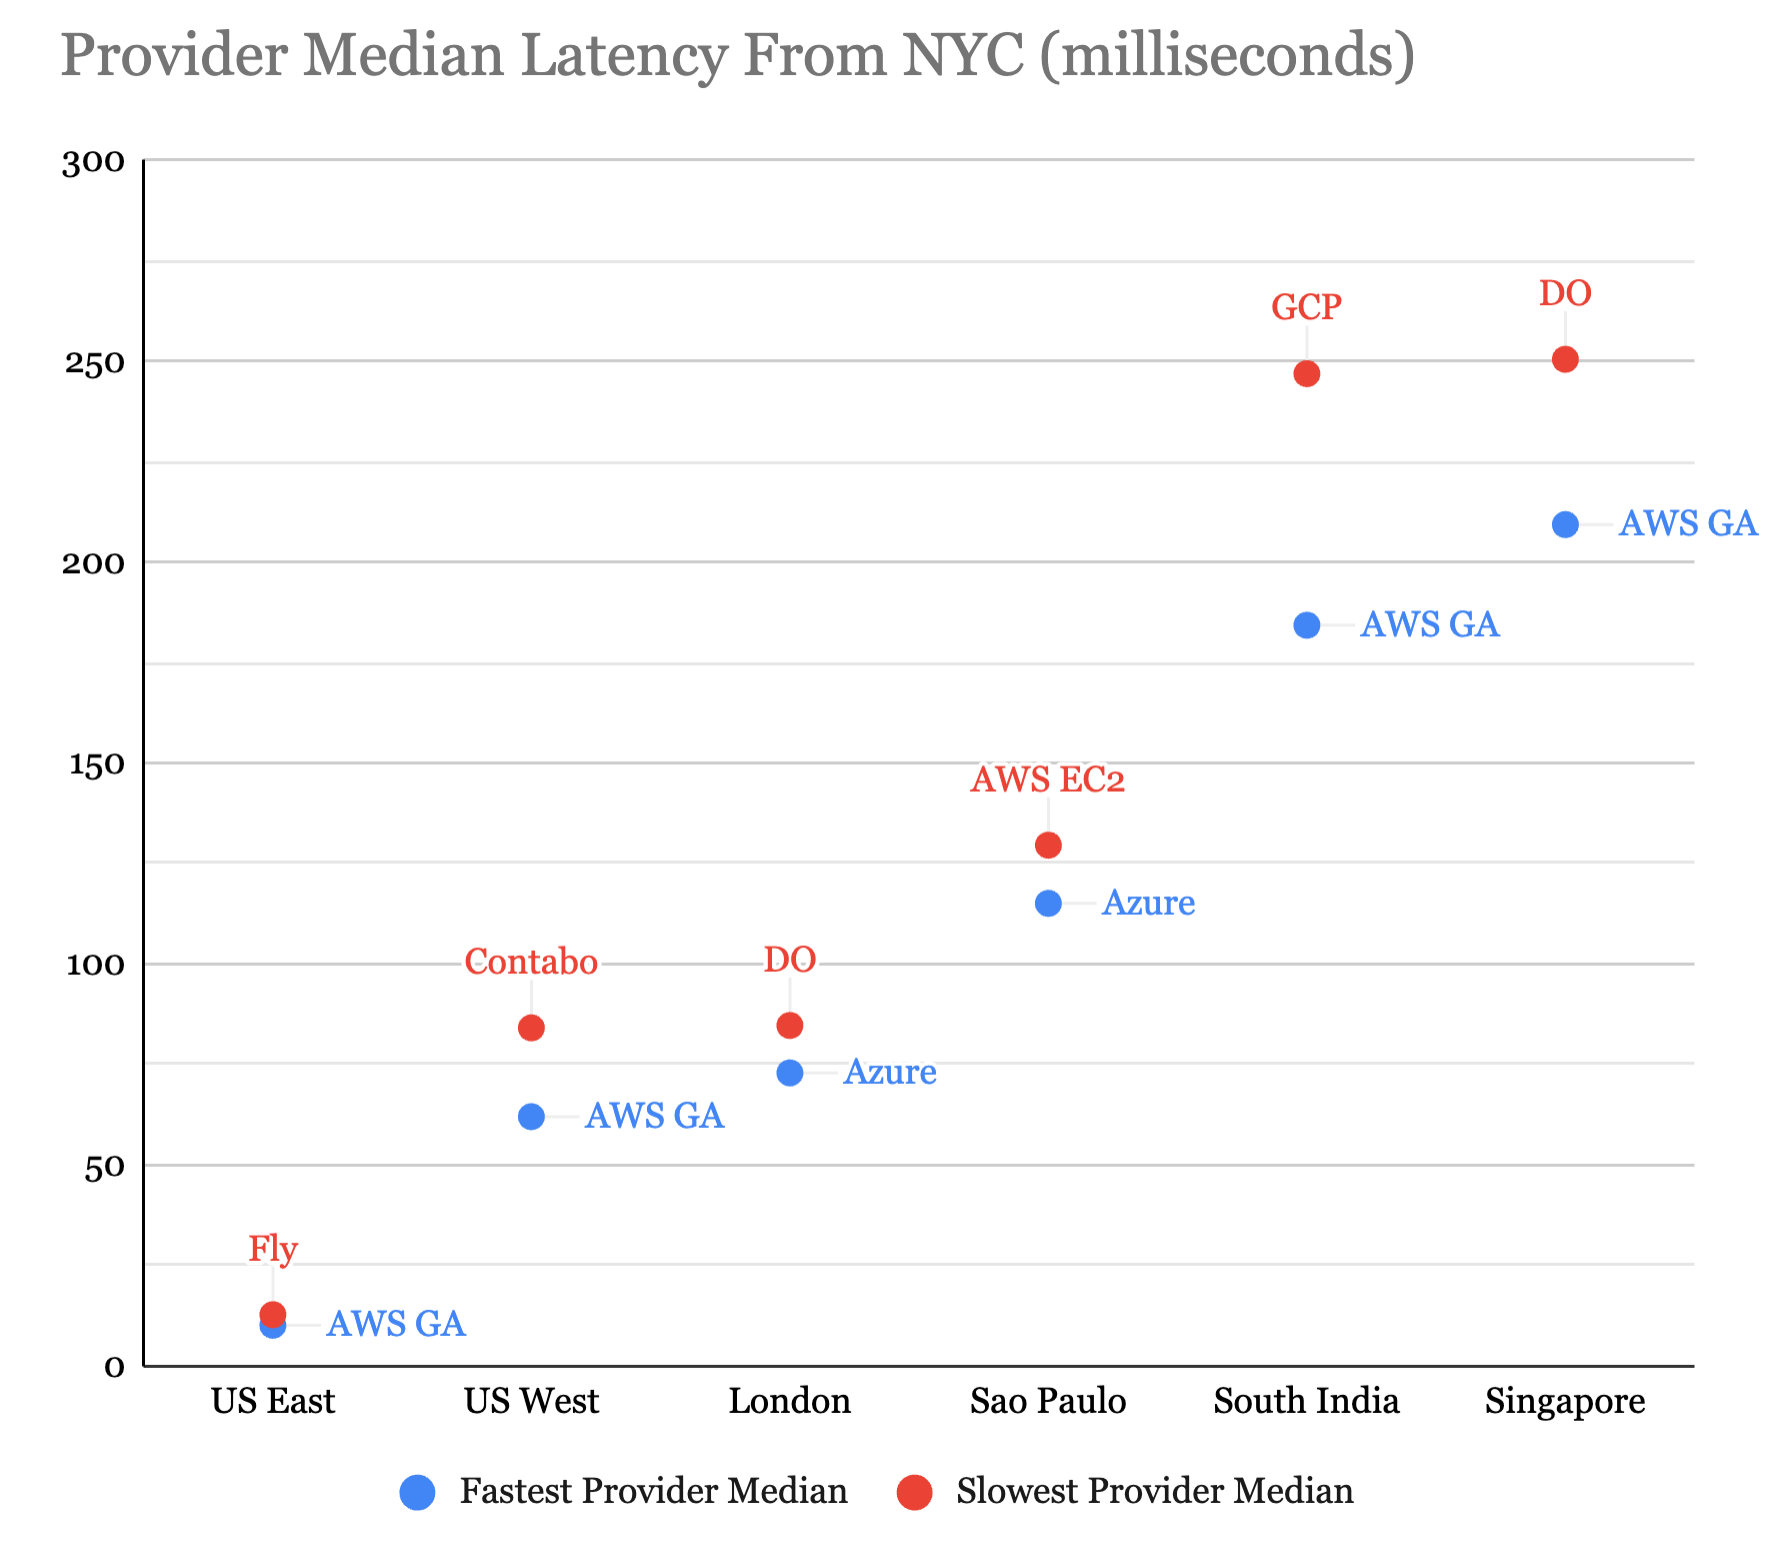
To gain further insight, let's zoom into a couple of particular routes.
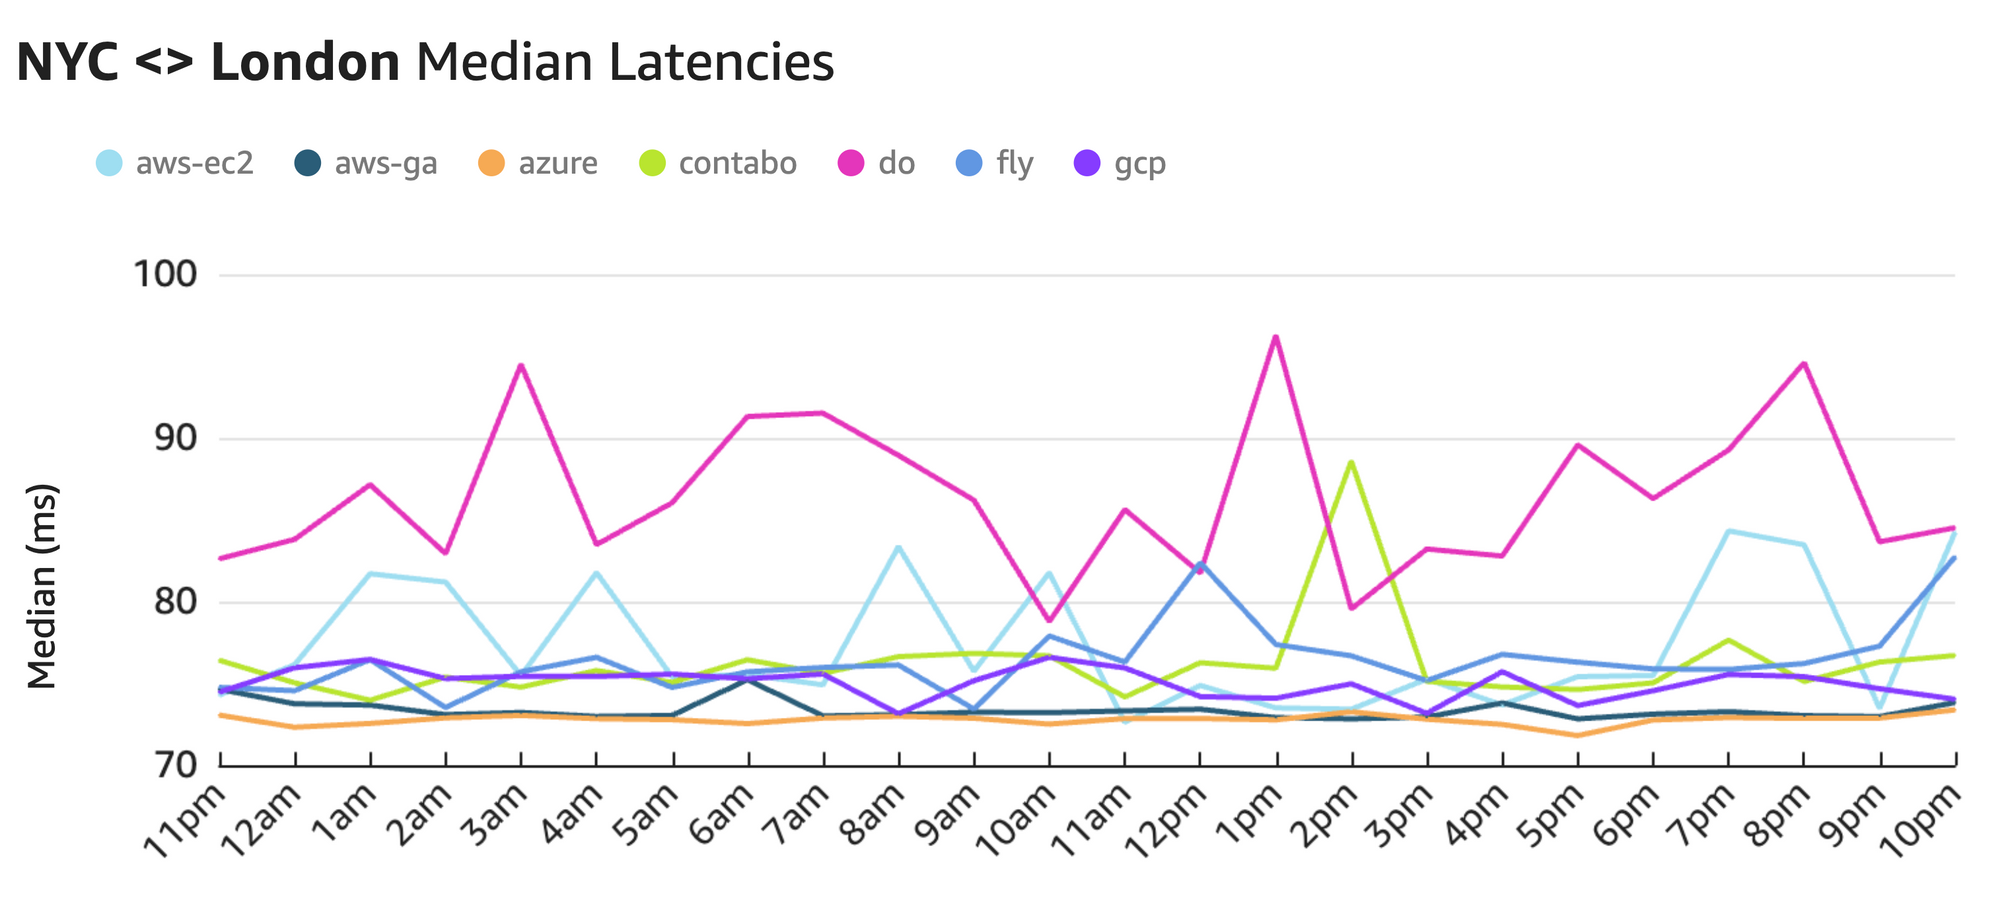
The average spread between the fastest provider (~73ms with Azure) and the slowest one (~85ms with Digital Ocean) is 12ms or 16%.
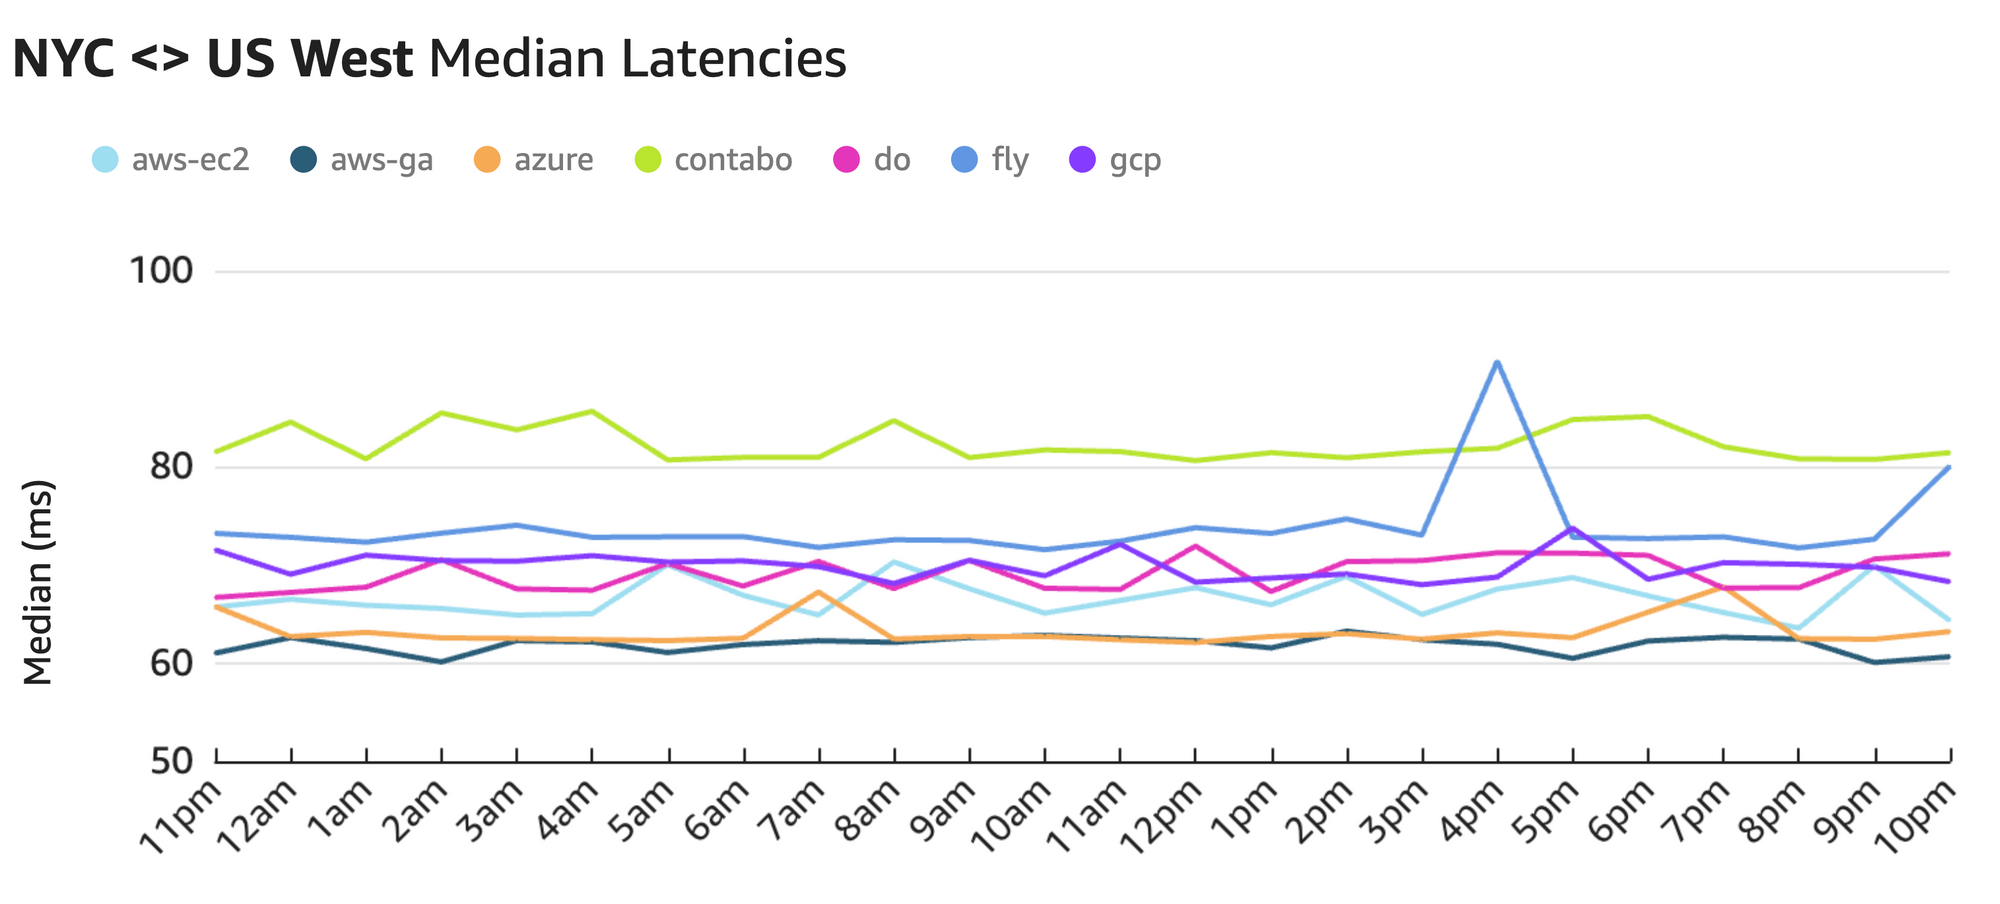
Here we see that the average spread between the fastest provider (~62ms with AWS GA) and the slowest one (~82ms with Contabo) comes out to a whopping 20ms, or 32%.
Research shows that humans can perceive latency as low as 13ms. For latency sensitive applications, like multiplayer games, a recent poll showed that over 70% of users would leave the application within 10 minutes of experiencing lag. The 20 milliseconds of additional latency that we see with Contabo can be the difference between a seamless user experience and a frustrating one.
Interpretation
To better understand these results, let's start by establishing a theoretical baseline for the latencies.
We can calculate the theoretical latency lower bound by multiplying distance and speed. The baseline for distance between two cities across the surface of the Earth can be estimated using the great-circle distance formula. For speed, we will use the speed of light inside fiber optic cable (~124,188 miles/second).
We can compare this latency lower bound with the best latencies observed in our data to get a measure of "efficiency" – how close can we get to the theoretical optimum?
| NYC <> London | NYC <> Seattle | |
| Distance Lower Bound | 3,500 mi | 2,400 mi |
| Theoretical Latency Lower Bound | 56 ms | 39 ms |
| Best Observed Latency | 71 ms | 60 ms |
| Efficiency | 79% | 65% |
We notice that the efficiency is significantly higher between NYC <> London compared to NYC <> Seattle. Additionally, recall from our benchmarking data we observed that the spread between fastest and slowest latencies across providers is much tighter in the London route (16%) versus the Seattle one (32%).
To explain this, first consider that the internet routes packets via a network of routers connected by fiber optic cable. The latency is affected by the total length of cable that packets have to travel as well as the number of routers along the way. For routes over water, a single undersea cable handles majority of the distance, thus requiring fewer intermediary hops; but over land, it's hard to run contiguous cables. Each router hop adds a) distance, since it's not a direct path between two points, and b) additional processing time, since the intermediary routers have to process each data packet and figure out where to forward it next.
Using this nifty online traceroute tool, we can roughly map out the physical route that the packets take on their way to the Contabo Seattle server:
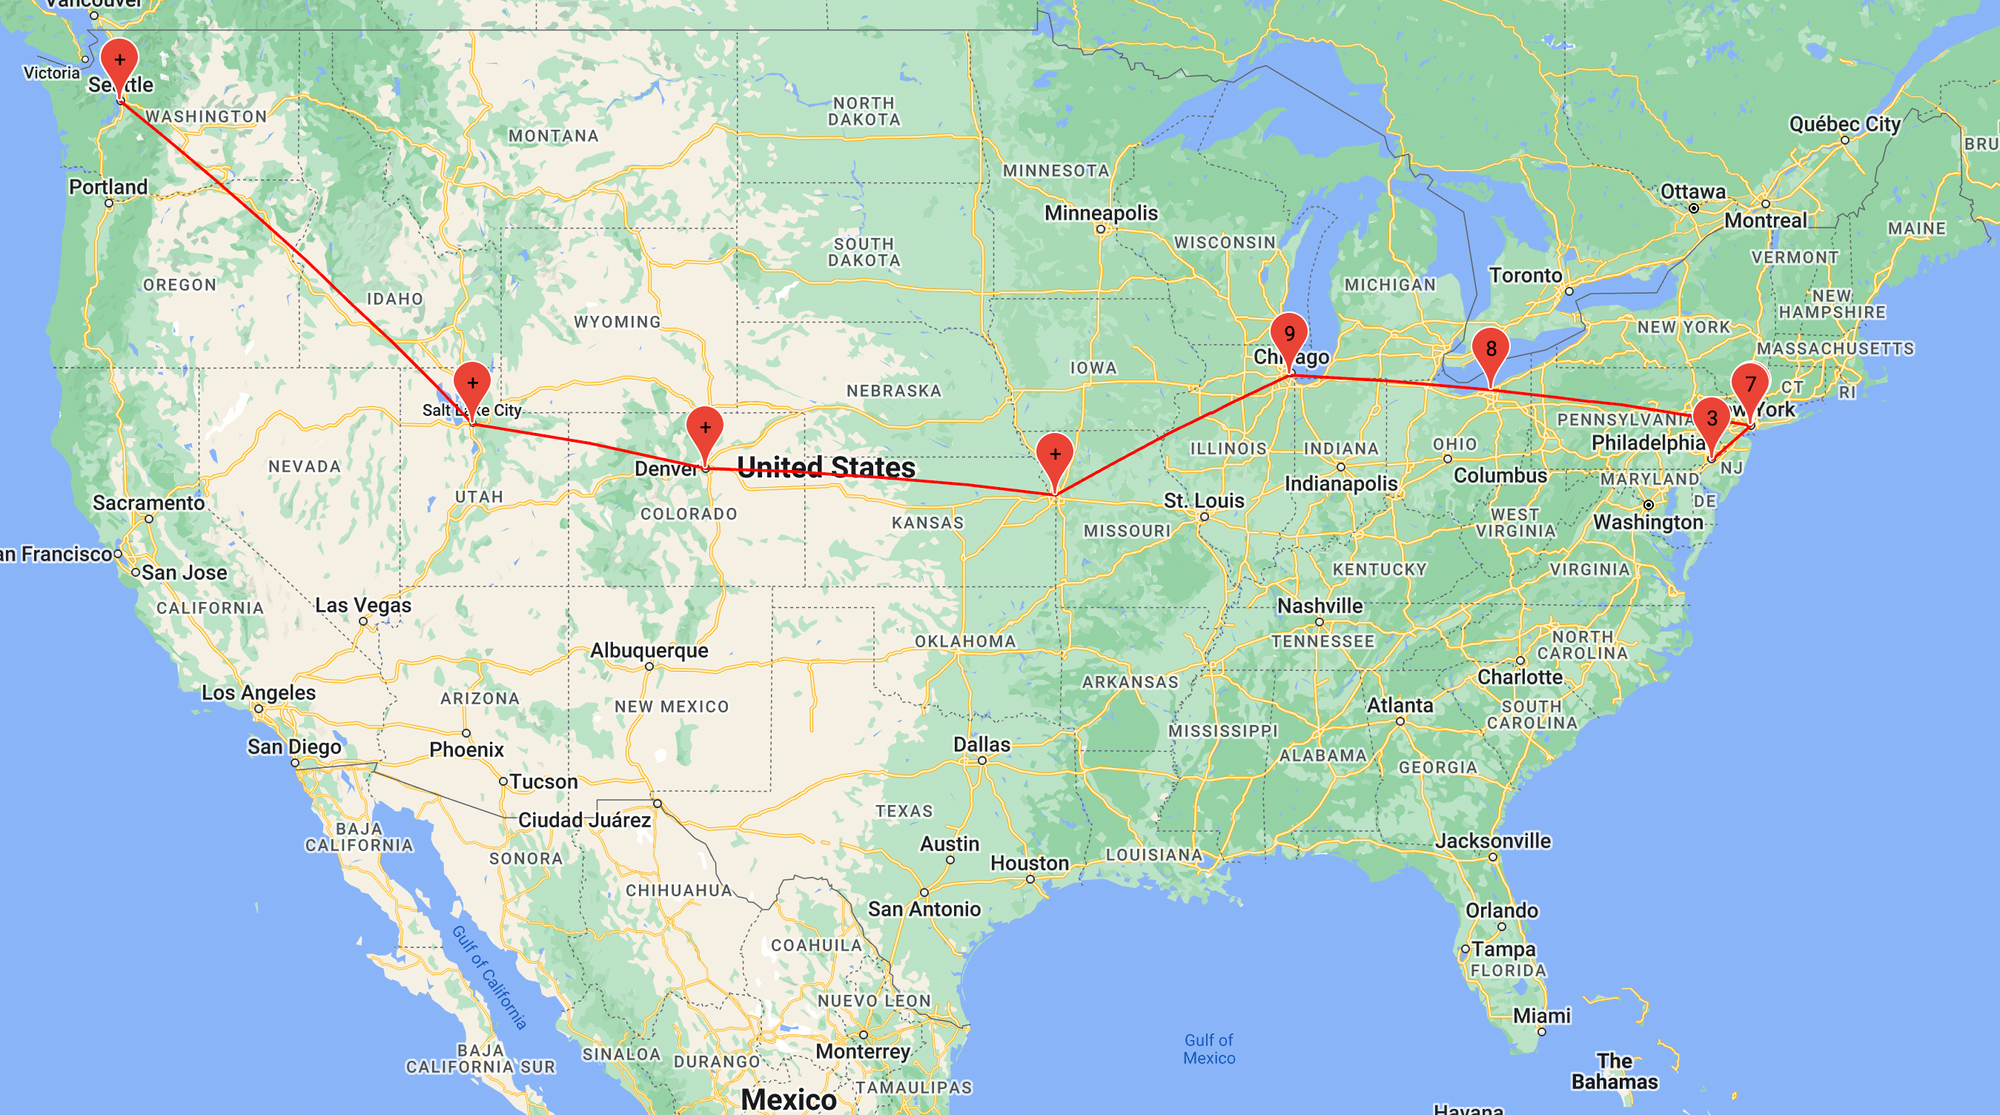
Digging into the traceroute output, we see that packets spend most of their journey to Seattle in Cogent's network. Cogent is an enterprise internet service provider aiming to meet the needs of globally distributed customers at the lowest cost possible. To reduce cost, they end up with lots of intermediary nodes, where they can pick up and drop off packets – similar to a local commuter train that stops at every station. This adds significant latency for packets traveling long distances.
Contrast this with cloud behemoths like AWS, Azure, or GCP, where direct links between data centers carry the majority of the traffic – similar to an express train that only stops at a few key stations. In addition to having dedicated links between their data centers, these providers also have extensive peering agreements with residential ISPs (like Verizon, Xfinity, etc) that they use to pull user traffic into their private networks as close to the source as possible.
So then why is Contabo's London performance relatively better than Seattle? This ties back to the fact that the majority of the NYC <> London route is over water, allowing it to take advantage of the many undersea cables spanning the Atlantic Ocean to cross in a single hop. Meanwhile, the NYC <> Seattle route ended up being far from a straight line, with several intermediary hops. This also explains the comparatively high spread amongst providers in the Seattle route – the providers that are able to route packets over their private networks vastly outperform those that are at the mercy of the public internet.
Conclusion
If you're looking for options to host your server for latency-sensitive applications and you want top-tier cross-region network performance, you'll want to leverage the existing optimized private networks. We talked about some of the major cloud providers in this blog post who obviously have some serious networking hardware deployed, but there are also entire companies dedicated to routing traffic performantly over their dedicated network lines.
Back in 2015, Riot games famously invested large amounts of money and effort to optimize network latency between gamers and their servers to under 80ms. However, for all but the largest of teams, it's impractical to compete in global network performance if hosting on bare metal or low level infrastructure providers like Contabo.
Hathora
At Hathora, performance is a part of our core DNA. Hathora Cloud, our platform for multiplayer games, leverages a massive edge network to ensure game servers are deployed close to their users. For cross-region play, we utilize data from sources like this benchmark to curate the best networks on which to route data.
Thanks to starline (Freepik) for the cover image!